
One of the most common analytics requests in a portfolio business sounds simple: “What was the open-account count at the last month-end?” In practice, answering that question often requires opening Snowsight, remembering which daily or monthly model contains the right field, applying the correct filter, and writing another one-off query. The same pattern repeats across OKR metrics such as open accounts, balances, spend, delinquency, revolve behavior, and new originations.
This creates a trust problem. When the same business question can produce slightly different numbers depending on which SQL pattern or metric definition is used, the issue is not only dashboard design. The issue is shared meaning. The goal of this project was to define each metric once, encode the business context behind it, and make those definitions accessible through a natural-language analytics experience.
The resulting architecture is a Snowflake-native stack: dbt models materialized in Snowflake, a Cortex Analyst semantic model staged in Snowflake, and a Streamlit in Snowflake app where users can ask questions in plain English. Snowflake serves as the center of the build because the data, semantic layer, SQL execution, and app experience can stay close together.
The idea: a semantic layer, not another dashboard
A fixed dashboard can answer known questions, but it is less flexible when analysts and data scientists need to ask follow-ups: “show the trend,” “break this out by product,” “compare actuals to target,” or “what changed in the last six months?”
The approach was to use Cortex Analyst on top of a well-described semantic model. The model encodes the business meaning once — what each table represents, how tables relate, what each metric means, which fields are safe to aggregate, and which caveats matter. With that layer in place, a natural-language question can generate SQL that follows the same rules every time.
Layer 1: a clean, layered data model
The first layer is standard data engineering: clean models, clear grain, and repeatable metric logic. A daily account-grain model serves as the base. On top of it sits a long-format metric registry — one row per metric × product × grain × date — created by computing metrics in a wide shape and using UNPIVOT to normalize them into a consistent structure.
That registry is materialized incrementally in Snowflake with a merge on a (date, metric, product, …) unique key. This keeps the daily refresh practical: new runs update the recent slice instead of rebuilding everything from scratch. More importantly, it creates one place where Cortex Analyst can read curated metric values and their metadata.
The reason for using a long format instead of another wide table is that every row carries a contract:
| Metric Name | Product | Unit | Metric Type | Value |
| open_accts | Card A | # | additive | 182,000 |
| balance | Card A | $ | non-additive (snap) | 4.2e8 |
The small column that does a lot of work here is metric_type. It identifies whether a metric is additive, like a daily count or spend amount, or non-additive, like a point-in-time balance. That one flag prevents a common analytics mistake: summing snapshots across days and getting a very precise, very wrong number.
Layer 2: the Snowflake semantic model
The second layer is the Cortex Analyst semantic model. It is a YAML file staged in Snowflake that maps business language to the physical data model. It defines logical tables, dimensions, time dimensions, and facts or measures, so Cortex Analyst has a structured way to translate a question like “show the balance trend by product” into SQL.
At a simplified level, the model looks like this:
tables:
– name: account_daily
base_table: { database: ANALYTICS, schema: MARTS, table: ACCOUNT_PORTFOLIO_DAILY }
dimensions:
– name: product
expr: PRODUCT
data_type: varchar
time_dimensions:
– name: reporting_date
expr: REPORTING_DATE
data_type: date
facts:
– name: current_balance
expr: CURRENT_BALANCE
data_type: number
This is where Snowflake helps the architecture stay simple: the semantic model points directly at Snowflake objects, Cortex Analyst generates SQL from that model, and the app executes that SQL back in the warehouse. There is no need to extract the data into a separate service just to ask a question about it.
However, schema mapping alone is insufficient. A schema tells Cortex Analyst where the columns are located. It does not, by itself, explain what the business means.
A schema isn’t enough: grounding the model in meaning
The first version of a semantic model can look promising because it generates SQL quickly. Testing against real stakeholder questions reveals why business context matters. The SQL can be syntactically correct and still be wrong: it can count an eligibility table as if it were an account table, sum a snapshot balance, or treat a metric with a posting lag as complete for the most recent day.
The main unlock was making that business context part of the semantic layer. Information that often lives in docs, message threads, dashboard notes, and analysts’ heads was converted into reusable semantic-model guidance.
A glossary, so words mean one thing: descriptions + synonyms
Plain English is friendly, but it is also ambiguous. “Active account” might mean an account that is open, carries a balance, or has purchase activity. “New cohort” might depend on a very specific cutover date. If those terms are not defined, the agent has to guess.
In the Cortex Analyst semantic model, description and synonyms make business vocabulary explicit:
dimensions:
– name: is_open
expr: OPEN_FLAG
description: “1 = account is currently open. Use this for ‘active account’ counts.”
synonyms: [“active account”, “open account”, “live account”]
This looks simple, but that is exactly why it works. The model no longer has to infer what “active” means from a column name. The team’s definition is embedded directly in the semantic model.
Data gotchas as guardrails: semantic-model instructions
Every mature data domain has traps that become obvious only after repeated query reviews and validation cycles. Those traps were turned into instructions and descriptions in the semantic model so Cortex Analyst could inherit the same judgment an experienced analyst would use:
| Scenario | Analytic Instruction |
| Lookalike vs. Account Tables | A lookalike table tracks ELIGIBILITY, not actual holders. For active counts, use the daily account table with open-flag = 1. |
| Settlement/Posting Lag | Most recent ~7 days are understated. Caveat or exclude the trailing window. |
| Sentinel Values | Values above a known threshold are “missing”. Cap them to zero before any SUM or AVG. |
| Snapshot vs. Flow | Point-in-time balances are non-additive; event-based counts are additive. |
This is one of the most human parts of the project. It is less about clever prompting and more about writing down the guidance an experienced teammate would give while reviewing the query.
Canonical metric definitions: measures
For each headline metric, the semantic model defines a single measure: what it is, how it is calculated, what grain it belongs to, and how people might ask for it. One definition, agreed once, reused everywhere:
measures:
– name: open_accounts
expr: COUNT_IF(OPEN_FLAG = 1)
description: “Count of currently-open accounts. Month-end snapshot; non-additive across days.”
synonyms: [“open accounts”, “# accounts open”]
The SQL is not the hard part here. The hard part is discipline. The moment a metric has two informal definitions, every downstream number becomes a debate. Encoding the measure in the semantic model gives both humans and Cortex Analyst one place to point back to.
A library of questions: verified queries
A set of verified queries was also added to the semantic model: real business questions paired with reviewed SQL. This gives Cortex Analyst examples of the patterns that matter and gives the Streamlit app a friendly starting point through suggested questions.
The questions were organized by audience:
| Persona | Sample Question |
| [Exec] | How have open accounts trended month-over-month over the last year? |
| [Product] | Which product is driving the change in open accounts? |
| [DS] | Has the balance-active rate shifted materially over time, and where? |
That small persona layer makes the experience more useful. The same metric can serve different decisions, and the agent should understand that context.
Layer 3: the question box
The final layer is the part users see: a lightweight Streamlit in Snowflake app. When someone types a question, the app calls Cortex Analyst, passes the staged semantic model file, receives generated SQL and an explanation, runs the SQL with a Snowpark session against a virtual warehouse, and renders the result as a table or chart.
The core flow is compact:
“`python
body = {
“messages”: history + [user_q],
“semantic_model_file”: “@cc.semantics.models/portfolio.yaml”,
}
resp = _snowflake.send_snow_api_request(
“POST”, “/api/v2/cortex/analyst/message”, {}, {}, body, {}, 30000
)
sql, text = parse(resp)
df = session.sql(sql).to_pandas(); auto_chart(df)
This is where the Snowflake-native architecture is especially useful. The chat experience, the semantic model, and the data all stay inside the same environment. The app does not need to be a large platform to be valuable; it just needs to remove enough friction for a data scientist to ask a follow-up question while the thought is still fresh.
An “actual vs target” view was also added, because many portfolio questions are not just “what happened?” but “how are results tracking against plan?” That makes the app less like a demo and more like a working surface for business review conversations.
Why the context mattered most
It is tempting to think the magic is Cortex Analyst. The practical lesson is that Cortex Analyst is only as useful as the semantic model behind it. The durable asset is not the chat box; it is the encoded business knowledge: descriptions, synonyms, instructions, measures, and verified queries.
There is a useful side effect too. The same semantic model that grounds the machine also becomes documentation for humans. A new analyst can read the definitions, gotchas, and examples and understand the domain faster. Both the agent and the analyst are grounded in the same source of truth.
The impact and the takeaway
Questions that used to require bespoke SQL can now be answered in seconds, in Snowflake, with a consistent definition behind every number. The data science team can explore independently instead of queuing every question, and analysts get more time back for actual analysis.
The important milestone was validation. The agent was tested with the data science team against known-good numbers and recurring business questions. That validation step moved the work from a promising demo to a useful analytical tool. It held up because the semantic model held up.
What’s live now: a governed agent for portfolio questions
The next step has now moved from roadmap to deployment. The semantic model and metric registry are powering a Snowflake-native credit card analytics agent, available through the Snowflake AI experience. The agent connects to governed semantic views in Snowflake and is organized around focused data objects for portfolio, transactions, acquisitions, payments, statements, authorizations, and daily account snapshots.
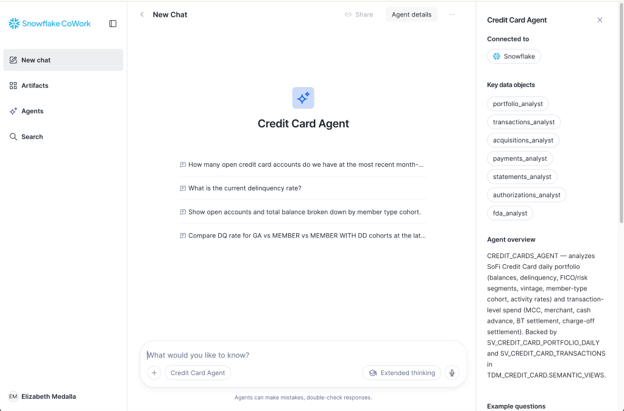
That means the data science team can ask recurring portfolio questions directly in the agent experience: open-account counts at the most recent month-end, current delinquency rate, balances by cohort, transaction-level spend questions, or comparisons across member-type segments. Behind the scenes, the same semantic definitions, verified query patterns, and Snowflake-governed data objects are used to generate and validate the answers.
This is the direction the project was aiming for: a governed analytical surface where business users can ask questions in a conversational way, while analysts and data scientists can still trust the generated numbers because the agent is grounded in the same source-of-truth definitions. The planned monthly business review (MBR) dashboard can now build on that foundation, using the same semantic model and metric registry so the curated dashboard and the conversational agent answer from the same logic.
That is the broader lesson from this project. A reliable Cortex Analyst agent does not start with the LLM. It starts with clean, well-described Snowflake models, a single source of truth for every metric, and a semantic model rich in business meaning. Streamlit in Snowflake and Snowflake AI make the experience approachable, and Cortex Analyst enables natural-language exploration, but trust comes from the underlying definitions.
Looking to get started? Reach out to evolv consulting.

Elizabeth Medalla is a data engineer consultant at evolv. Elizabeth builds and maintains end-to-end data pipelines and trusted reporting datasets across Banking, Investments, and Credit Cards. She works across Airflow, dbt, Snowflake, AWS, Docker, and Tableau to turn complex source data into reliable, decision-ready data products.